Abstract
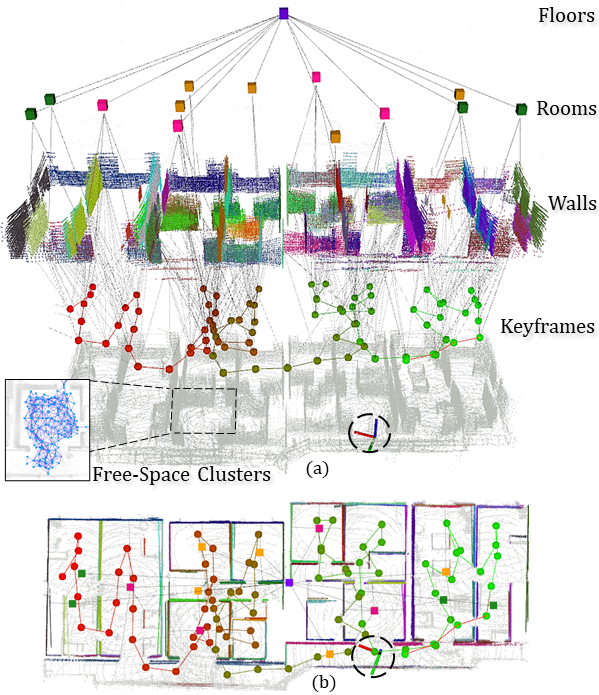
3D scene graphs represent the environment in an efficient graphical format of nodes and edges representing different geometric elements with suitable semantic attributes and relational constraints with other elements. Nevertheless, existing methods do not efficiently couple the scene graph with the SLAM graph generating it, to simultaneously improve in real- time the metric estimate of the robot pose or its map estimate. In this direction, we present an evolved version of the Situational Graphs (dubbed S-Graphs+), which jointly models in a single optimizable graph a set of robot keyframes as well as the high- level representations of the environment.
S-Gaphs+ is a four-layered optimizable graph that includes:(1) a keyframes layer in which robot poses are estimated, (2) a walls layer consisting of all the registered wall planes, (3) a rooms layer constraining the mapped wall planes, and (4) a floors layer encompassing the rooms within a given floor level. To efficiently represent rooms and floors we present novel room and floor segmentation algorithms utilizing the mapped wall planes and free-space clusters. We test S-Graphs+ on simulated datasets representing distinct indoor environments, on real datasets captured on several construction sites and office environments, and on a public dataset captured in indoor office environments. S-Graphs+ outperforms relevant baselines in the majority of the datasets, while extending the robot situational awareness by a four-layered scene model.
Architecture
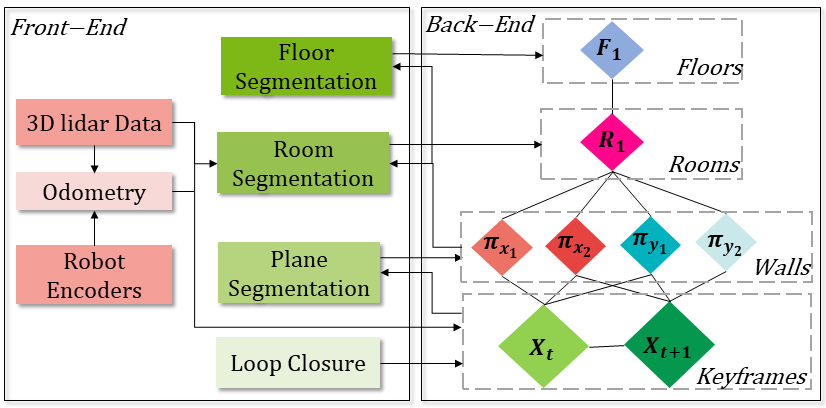
The architecture of S-Graphs+ is illustrated in the figure. Its pipeline can be divided into six modules, and its estimates are referred to four frames: the LiDAR frame L, the robot frame R, the odometry frame O, and the map frame M. L and R are rigidly attached to the robot and then depend on the time instant t, while O and M are fixed.
The first module receives the 3D LiDAR point cloud in frame L, which is pre-filtered and downsampled. The second module estimates the robot odometry in frame O either from LiDAR measurements or the robot encoders. Four additional font-end modules generate the four-layered topological graph modelling the understanding of the environment, namely: 1) The plane detection module, segmenting and initializing wall planes in the map frame M using the point clouds at each keyframe. 2) The room detection module, generating first free-space clusters from the robot poses and 3D LiDAR measurements, and then using such clusters along with the mapped planes to detect room centers in frame M. 3) The floor detection module, utilizes the information of all the currently mapped walls to extract the center of the current floor level in frame M. 4) Finally, the loop closure module, which utilizes a scan-matching algorithm to recognize revisited places and correct the drift.
Room Segmentation
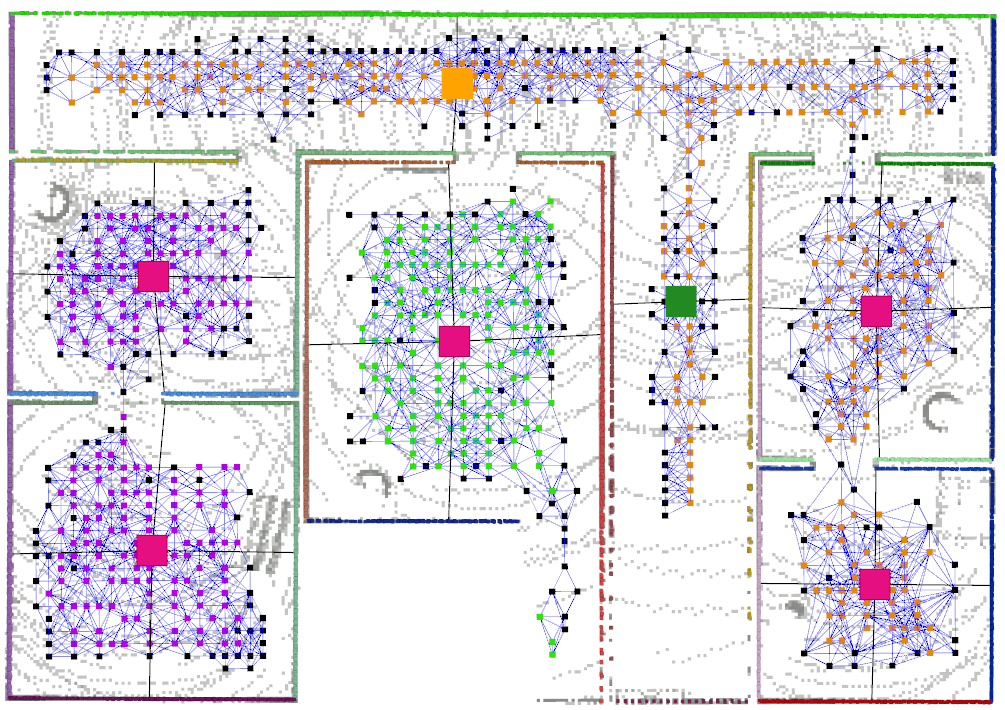
In this work, we present a novel room segmentation strategy capable of segmenting different room configurations in a structured indoor environment. It consists on two steps, FreeSpace Clustering and Room Extraction, and the output are the parameters of four-wall and two-wall rooms. Free space clustering and rooms segmentation is obtained from the estimated wall planes surrounding each cluster. Pink colored squares represent a four-wall room, while yellow and green colored squares represent two-wall rooms in x and y directions respectively. Nodes colored in black are those that are closest to walls and vote for splitting the graph
Experimental Validation
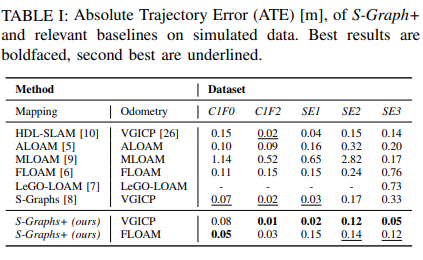
We validate S-Graphs+ on simulated and real-world scenarios, comparing it against several state-of-the-art LiDAR SLAM frameworks and the baseline S-Graphs. The experiments cover a wide array of scenes, from construction sites to office spaces, and use data recorded in-house and from the public TIERS dataset.
The figure represents the final maps generated by S-Graphs+ and baselines, in-house seq. C4F0
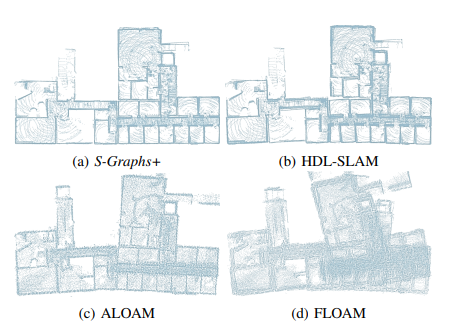
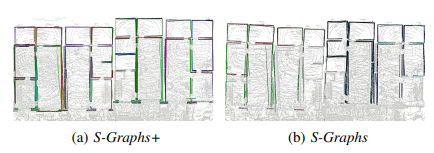
Figure shows S-Graphs+ and S-Graphs maps, in-house seq. C2F0

Map estimated by S-Graphs+ on TIERS sequence T11


Additional Results
In-House Dataset C2F1
In-House Dataset C3F2
In-House Dataset C4F0
Citations
- Hriday Bavle, Jose Luis Sanchez-Lopez, Muhammad Shaheer, Javier Civera, Holger Voos. S-Graphs+: Real-time Localization and Mapping leveraging Hierarchical Representations. arXiv, 2022.[BibTeX] [Download PDF]
@article{hriday bavle 2022s, title={S-Graphs+: Real-time Localization and Mapping leveraging Hierarchical Representations}, author={Hriday Bavle and Jose Luis Sanchez-Lopez and Muhammad Shaheer and Javier Civera and Holger Voos}, journal={arXiv}, year={2022} } - Hriday Bavle, Jose Luis Sanchez-Lopez, Muhammad Shaheer, Javier Civera, Holger Voos. Situational Graphs for Robot Navigation in Structured Indoor Environments. IEEE Robotics and Automation Letters, 2022.[BibTeX] [Download PDF]
@article{hriday bavle 2022situational,
  title={Situational Graphs for Robot Navigation in Structured Indoor Environments},
  author={Hriday Bavle and Jose Luis Sanchez-Lopez and Muhammad Shaheer and Javier Civera and Holger Voos},
  journal={IEEE Robotics and Automation Letters},
  year={2022},
  doi={10.1109/LRA.2022.3189785}
}